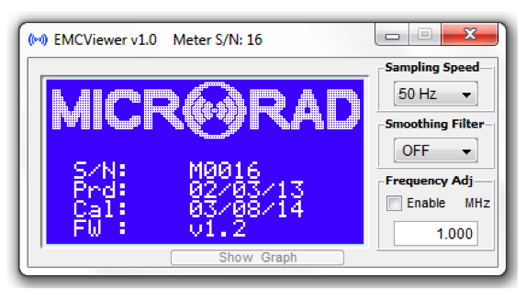
The EMC Viewer allows the user to connect to a virtually unlimited number of sensors (currently configured for up to 8 sensors simultaneously).
The software is simple and intuitive, it displays the current values and trends time/frequency allowing to export data and images.
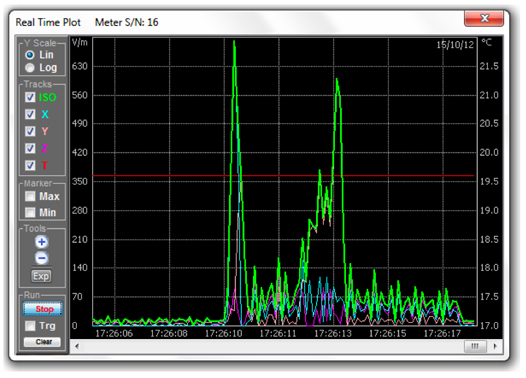
Time trends in field X, Y, Z, ISO and temperature
Displayed information:
- Unit of Measure of the Field (selectable sequence: V/m, A/m, Wm2, mW/cm2)
- Indicator of the level of battery charge, percentage and graph
- Actual value of measured field
- Maximum value of the measured field
- Temperature (°C)
- Value of the field measured on each axis X, Y, Z
- Selectable filters
- Selectable correction factors in the frequency domain
Other functions:
- Data and images export
- Trigger threshold level of acquisition
- Zoom
- Amplitude/Time Marker
- Start/Stop Acquisition
Exp button allows the operator to export as an image file of the graph currently displayed, or export the data in Excel format.
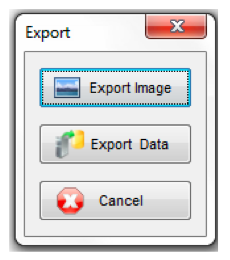
Export menu